What Is ROA? Calculating Return on Assets and Filtering Stocks
Fundai Education Team · · 7 min read

ROA shows how many rials of net profit a company makes from each rial of assets; how to calculate it, how it differs from ROE and how to filter on it in Fundai.
In answer to what ROA is: ROA, or Return on Assets, is a ratio that shows how many rials of net profit a company has made from each rial of its total assets. In Fundai this ratio is shown as ROA TTM, meaning net profit of the last four quarters divided by total assets, next to the industry and market figures. In this guide you will see step by step where the numbers come from, how it is calculated and how to filter with it.
What is ROA and what does it measure?
ROA is net profit divided by total assets, as a percentage. Assets are everything the company holds, from cash and inventory to buildings and machinery.
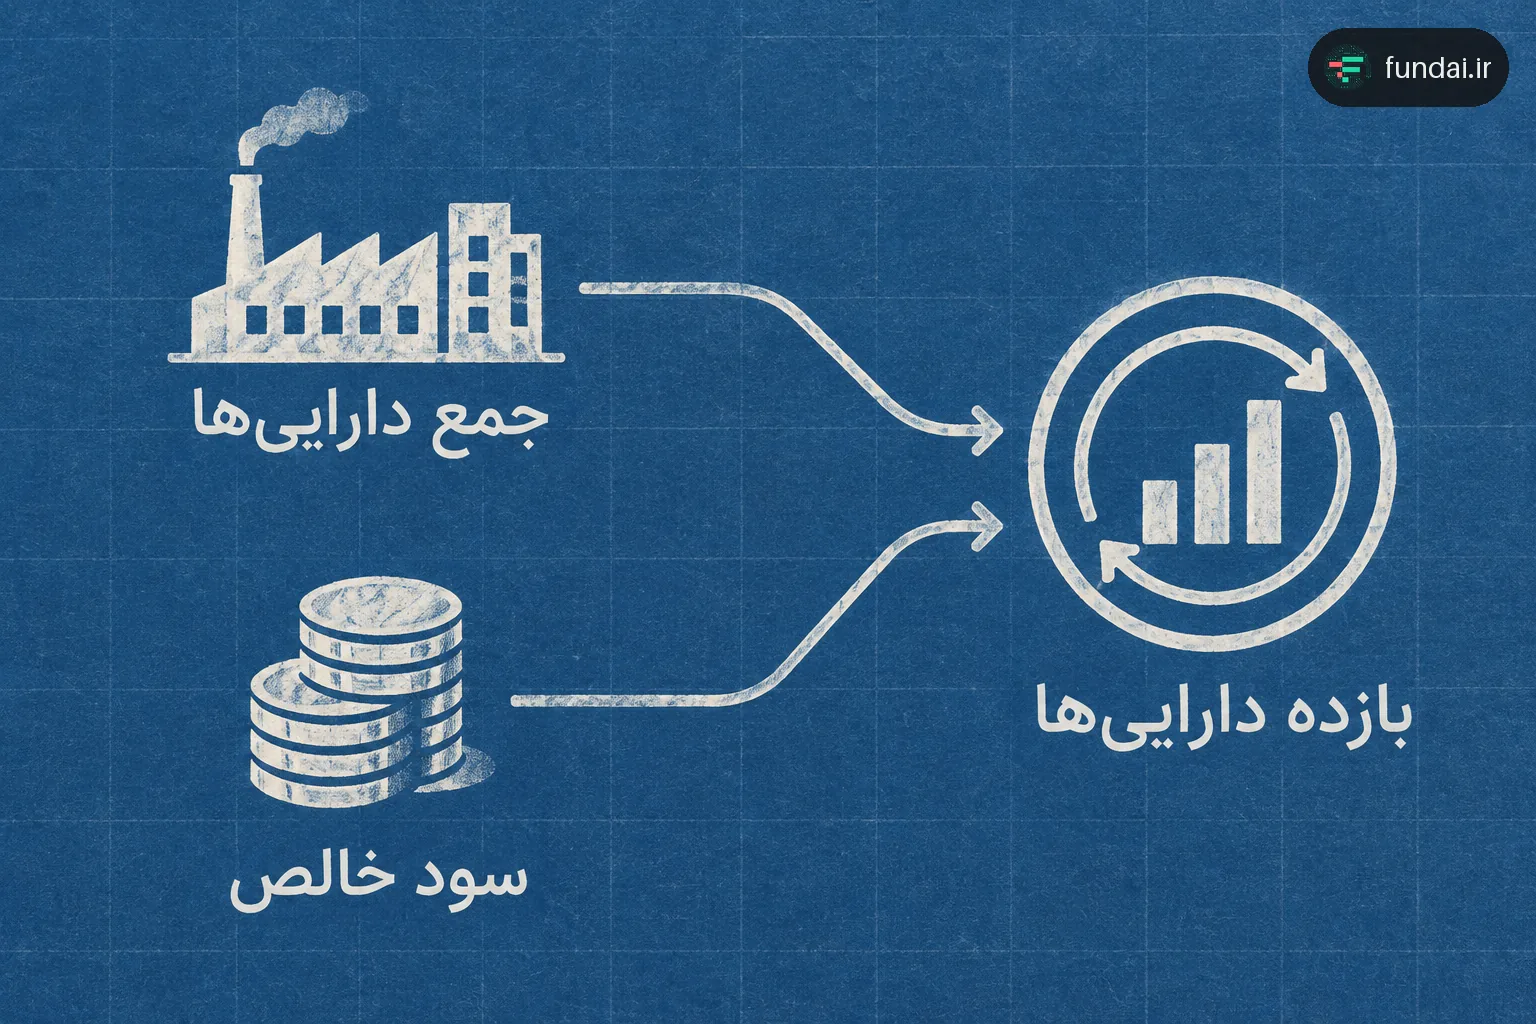
On the balance sheet, total assets equal total liabilities plus equity; that is, every asset is funded with creditors' or owners' money. ROA ignores this split and measures the productivity of all resources. The denominator of ROE is only equity, that is, total assets minus total liabilities.
ROA TTM divides the net profit of the last four reported quarters by total assets. Period ROA is the same ratio on the reported period, for example on six-month profit, and has not been annualized. So the two are not comparable.
What is the ROA formula and which financial statement should you take the figures from?
The ROA formula has two figures: TTM net profit from the income statement and total assets from the balance sheet of the latest report on the Codal system. You build the profit for the last four quarters, because interim reports are cumulative.
ROA TTM (percent)
Net profit of the last twelve months (billion tomans)
Take the previous fiscal year's profit On the company's reports page in Fundai, open the income statement and note the net profit of the latest fiscal year. This annual statement is audited.
Find the cumulative profit of the current year From the latest interim report, for example the six-month one, read this year's net profit. This figure is not counted as audited.
Subtract the profit of the same period last year The comparative column of the same report shows the profit of the similar period last year. Subtract it from the sum of the two previous figures to get TTM.
Take total assets from the balance sheet The balance sheet is a position at one date; take the figure for the latest report date and divide the TTM profit by it.
Calculating ROA with a step-by-step example
Step one: building the last twelve months' profit
TTM net profit (billion tomans)
We add this year's six-month profit and subtract the profit of the same six months last year. The result is the profit of the last four quarters, not the profit of the latest fiscal year.
Step two: dividing by total assets
TTM net profit (billion tomans)
Total assets (billion tomans)
ROA TTM (percent)
ROA TTM in this example is 14%; that is, for every rial of assets the company recorded 0.14 rial of net profit over the last four quarters. This number only describes the past.
Step three: matching against a real company in Fundai
For a real company, take the four figures from the income statement and balance sheet on the company's reports page and repeat the calculation above. The result should match the ROA TTM in the financial ratios tab, with a rounding difference of one or two decimal places. If it differs, check the units first and then the current-year column.
What is the difference between ROA and ROE, and why does debt raise ROE?
ROA measures net profit against total assets and ROE measures the same profit against equity; as debt grows, equity gets smaller and ROE looks higher, even if the assets have made the same amount of profit.
ROE TTM is the net profit of the last four quarters divided by total equity. The numerator is the same in both ratios, so the difference comes only from the denominator. For details, see What is ROE? A step-by-step guide to calculating and filtering return on equity.
Net profit of both companies (billion tomans)
Equity of company A (billion tomans)
ROE of company A (percent)
Equity of company B (billion tomans)
ROE of company B (percent)
| Hypothetical company | ROA TTM (percent) | Debt to assets (percent) | Debt to equity (times) | ROE TTM (percent) |
|---|---|---|---|---|
| A | 10 | 20 | 0.25 | 12.5 |
| B | 10 | 80 | 4 | 50 |
The debt-to-assets ratio is total liabilities divided by total assets, as a percentage. The debt-to-equity ratio is total liabilities divided by total equity and is expressed in "times", not percent.
Total liabilities are not only loans; they also include trade and non-trade payables, taxes and dividends payable, advances received, provisions and financial facilities. So a company with no bank loans can also have a high debt ratio.
A high ROE alone is not a sign of strength. Company B's ROE is four times that of A, while its assets have not made more profit. Read ROA next to ROE and the debt-to-equity ratio to see whether a high ROE comes from profit or from a small denominator.
What ROA is good, and how do you filter on it in Fundai?
There is no magic number for ROA; you compare it with the figure for the same industry and with the same company's earlier periods. The industry figure in Fundai is the ratio of two sums, not a simple average of companies, and it covers companies on the Tehran Stock Exchange and Iran Fara Bourse.
Asset-heavy industries such as steel and petrochemicals need factories and heavy equipment to produce, and their total assets are large; light industries work with fewer assets. For this reason a within-industry comparison makes sense, not a comparison of a steel company with a light-industry company.
The company's financial ratios page Open the company's financial ratios tab and see ROA TTM next to the industry and market figures.
Choosing the industry On the filters page, in the "General filters" section, choose the industry or sub-industry you want.
Adding the ROA condition Click the "Financial ratios" family and choose ROA. Set an operator ("greater than", "less than" and so on) and a number taken from the industry figure.
Sorting the result The returned companies appear in one table. Sort the columns and open each company's page to see its net profit and total assets.
ROA measures net profit against total assets and ignores how they are funded; that is why it makes sense next to ROE. When ROE is much higher than ROA, look into the debts, because a small denominator can make up the whole difference.
The method is simple: measure ROA within its own industry against the industry figure and the same company's trend, read it next to ROE and the debt-to-equity ratio, and use the filter only to list companies in the same industry. The filter result is a starting point for research, not a verdict. A past number does not guarantee the future, and the final decision is yours.
What is ROA and which financial statement is it calculated from?
ROA is the return on assets ratio. You take the numerator from the income statement and the denominator from the balance sheet.
Why shouldn't we compare period ROA with ROA TTM?
The period version is calculated on the profit of the reported period and has not been annualized, while TTM takes the profit of the last four quarters; their bases differ.
What percentage is a good ROA?
There is no fixed number. You compare ROA with the industry figure and the same company's earlier periods, because asset-heavy and light industries have different structures.
#ROA #Return on Assets #Fundamental Analysis #Stock Screener #Financial Ratios